![[Full Usage Guide] Using the Windows Diagnostic Tools](https://cdn.techloris.com/app/uploads/2023/05/run-windows-diagnostic-tools.png)
[Full Usage Guide] Using the Windows Diagnostic Tools

Windows Diagnostic Tools is a suite of troubleshooting and diagnostic tools designed to help users identify and resolve issues with their Windows operating system. A Windows diagnostic tool can scan for malware, optimize system performance, diagnose hardware problems, and detect other potential issues that could lead to computer instability or data loss.
While many of these tools are natively available in modern versions of Windows, they can also be installed from the Microsoft Store or downloaded separately. With these tools, users can monitor their system health, troubleshoot slowdowns or crashes, fix software configuration errors, and much more.
Use the Performance Monitor Tool
The easiest way to run the Windows memory diagnostic tool is to use the performance monitor tool. It helps to check the device’s performance along with the operating system. Here is how to use the performance monitor tool.
Step 1: Launch the Windows performance monitor tool from Windows main menu. Type performance monitor in the taskbar’s search and double-click the option in the list to open the tool window.

Step 2: In the tool window, click the option of data collector sets to expand. Select the option of the system from the list.

Step 3: In the system option, select the option of system diagnostics and right-click it to choose start from the context menu.

Step 4: In the next step, again click the option of reports in the monitor tool window to expand. Now select systems, followed by clicking the option of system diagnostics.
Step 5: In the system diagnostics option, you will see the reports for the monitor tool. Double-click the report to check the system’s performance.
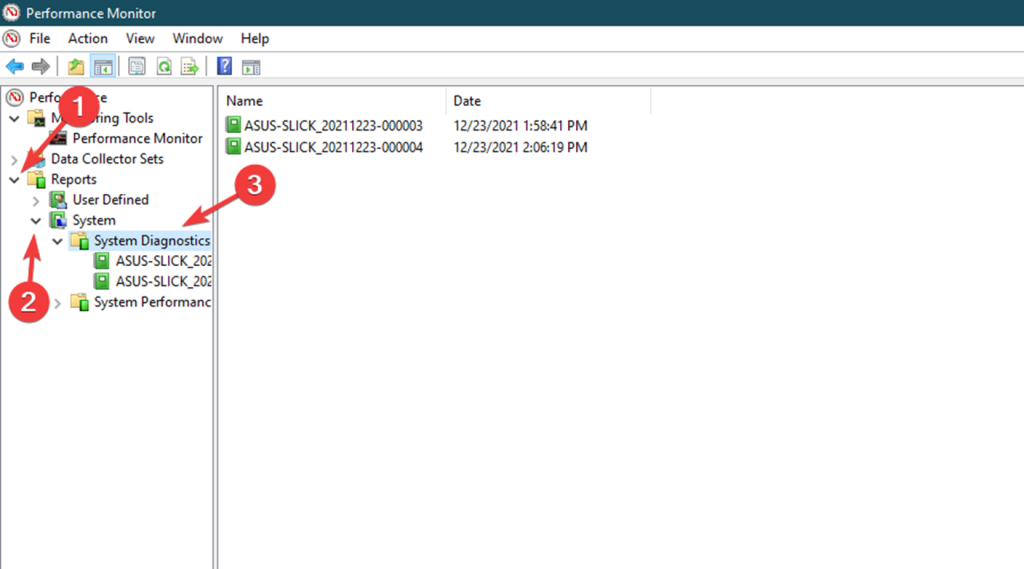
Step 6: In the report, navigate to the section of basic system checks to see if your device is working fine without any potential threat of errors.

Use Windows Memory Diagnostic App
One can utilize the Windows memory diagnostic app to check the device’s performance. It is a kind of in-built diagnostic tool/computer diagnostic tool or hardware diagnostic tool which facilitates generating and viewing the detailed reports of the device and displays errors in specific programs if causing a disturbance in functionality. Here is how you can run the Windows memory diagnostic app.
Step 1: Launch the Windows memory diagnostic app from Windows main menu. Type Windows memory diagnostics in the taskbar’s search and double-click the option in the list to open the app.

Step 2: In the pop-up window, select the option of optionRestart Now and check for problems (recommended). It will restart the device. Once your device restarts, it will automatically run the diagnostic scan.

Step 3: Once the scan is complete, reboot the device.

Step 4: Scan or diagnostic report results can be viewed in the event viewer app. Launch the event viewer app from the main menu. Type event viewer in the taskbar’s search and double-click the option in the list to open the app.

Step 5: In the window, click the Windows logs option to expand and select system.

Step 6: In the right pane of the system menu, click on the system to expand and click find.

Step 7: In the Find pop-up window, type memorydiagnostic followed by clicking find next to check the memory diagnostics log.
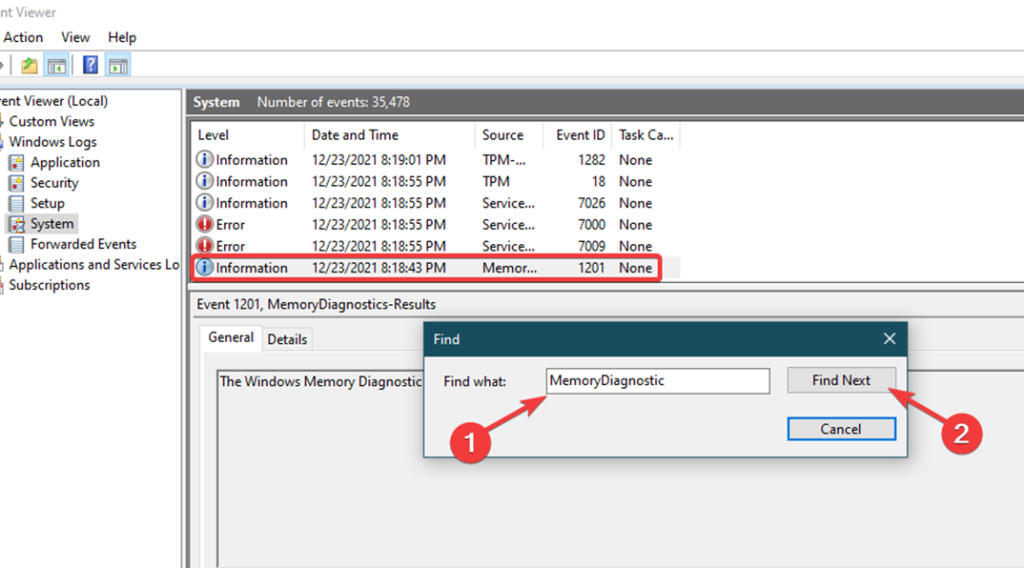
Step 8: Click the General tab to view the report in the memory diagnostic results.

Run CHKDSK Scan
To check the Windows or device’s performance, one can view the disk usage or potential errors if restricting the device’s performance. In this context, using the Chkdsk command via command prompt can fix software and hardware-associated errors. It runs a scan and fixes the error, and it helps to check and fix the disk errors automatically on the device. Here are the steps to run Chkdsk.
Step 1: Launch the command prompt from the run utility. Click Windows key+ R, and type cmd in the run command box. Click ok to continue.

Step 2: In the command prompt, type chkdsk c: /f /r and click enter to continue. In the next line, type Y to proceed. Restart your device and check if the device and disk work properly.

Step 3: Scan or diagnostic report results can be viewed in the event viewer app. Launch the event viewer app from the main menu. Type event viewer in the taskbar’s search and double-click the option in the list to open the app.

Step 5: In the window, click the Windows logs option to expand and select system.
Step 6: In the right pane of the system menu, click on the system to expand and click find.
Step 7: In the Find pop-up window, type Wininit and click Find next to check the memory diagnostics log.

Step 8: Click the General tab to view the report in the memory diagnostic results.
Run Battery Diagnostics Command
The device’s performance also depends on the performance of the battery. To check the battery’s health and performance, one can run the battery diagnostics command via an administrative command prompt, i.e., Windows PowerShell (admin). Here are the steps to follow:
Step 1: Launch Windows PowerShell(Admin) via the keyboard’s Windows key+ X shortcut key. Double-click the list’s PowerShell (Admin) option to launch the prompt window.

Step 2: In the prompt window, type powercfg/batteryreport and click enter to execute the command.

Step 3: The battery diagnostic report will be generated as an HTML file. Click open the file to view the report.

Restore Microsoft.NET Framework Installation
Every program on the device depends on its particular .NET framework. Hence, any issue with the framework may lead to errors causing poor performance. Thus, restoring the Microsoft.NET framework installation may help improve the Windows program performance. Here are the steps to follow:
Step 1: Launch the program window via the keyboard’s Windows key+ S shortcut keys.
Step 2: In the programs window, select the option of programs and features followed by clicking the link of the option that turns Windows features on or off.

Step 3: In the next step, click the option of Microsoft.NET Framework followed by clicking Change or Repair.
Step 4: Follow the on-screen instructions wizard to repair the .NET framework.

Reinstall Microsoft.NET Framework
Being a software to work in association with Microsoft, .NET framework supports all applications via .NET technologies. In this context, accurate installation of the .NET framework is the prime factor that decides the fate of applications running on the device. Hence, reinstallation of the .NET framework can fix the issues with a particular program to improve the device’s performance. Here are the steps to follow:
Step 1: Launch the control panel on the device from the taskbar’s search. Type control in the search box and double-click the option to launch it.

Step 2: In the control panel menu, navigate to the option of programs and features.

Step 3: In the next window, select the option of turn Windows features on or off in the left panel.

Step 4: Windows features will appear in the pop-up window. Locate .NET Framework 3.5(include .NET 2.0 and 3.0) and click ok to continue.
Step 5: Follow the steps to download .NET framework and install it on the device. Restart the device to check if the error still exists.
Scan PC for Potential Malware
Any potential viruses or malware that threatens your device can result in functionality errors on the device. The same goes for windows explorer. If malware attacks the system files linked to windows explorer, it can result in a Windows Explorer stopped working error. Here is how you can scan the malware on the device.
Step 1: Launch settings from Windows main menu. Right-click the Windows icon and select Settings from the list.

Step 2: In the settings menu, select the option update and security, select the option of Windows security, and select virus and threat protection from the left pane.
Step 3: Run the scan for malware in the virus and threat protection section. Follow the on-screen wizard to run the scan and fix the malware issue.

Effectively Use the Windows Diagnostic Tools
In this comprehensive guide, we explored the various Windows Diagnostic Tools and how they can help you troubleshoot and resolve issues on your computer. From built-in tools like Event Viewer, Performance Monitor, and Reliability Monitor to advanced tools like Resource Monitor and System Configuration, you now have the knowledge and tools to diagnose and fix problems effectively. With the Windows Diagnostic Tools at your disposal, you can take control of your computer’s performance and ensure a smooth and optimized experience.
Frequently Asked Questions About Windows Memory Diagnostic Tool
What Are Computer Diagnostic Tools Used for on Windows?
Computer diagnostic tools diagnose and troubleshoot various issues on Windows PCs running Vista. These tools can detect hardware and software problems and identify potential threats. Diagnostic tools can also help optimize settings for better performance and provide detailed system reports.
Why Aren’t My Hardware Diagnostic Tools Working on Windows?
If you’re having difficulty running hardware diagnostics on Windows Vista, there are several potential causes. One common issue is that your computer may use too much memory, preventing the diagnostic tools from working correctly. Another likely culprit is a missing or damaged system driver, which could interfere with the functionality of the diagnostics program.
What Is an Intel Processor Diagnostic Tool?
The Processor Diagnostic Tool is a software-based tool used to verify the functionality of an Intel microprocessor. It is available for both Windows and Linux systems. This diagnostic tool can check the processor’s clock speed, core temperature, memory usage, cache size, power consumption, voltage settings, and Windows diagnostics.
Why Can’t I View My Windows Diagnostic Data Viewer?
There may be a few reasons if you cannot find the Windows Diagnostic Data Viewer in your task manager. Firstly, checking that the feature is enabled and up-to-date on your computer is important. To do this, go to ‘Settings’ and then ‘Privacy,’ where you can check the status of your Diagnostic Data Viewer. If it is not already enabled, you can toggle it on.
Why Is My Resource Monitor Frozen on Windows?
If your Resource Monitor appears to be frozen on Windows, it could have something to do with the overall health status of your system. To investigate further, you should check the Task Manager for any specific tasks that may consume a lot of resources and causing the freeze. If you see some tasks eating up more than their fair share of resources, you can try to end them by right-clicking on them and selecting the “End Task” option.